Canon EOS 5D Mark II Dark Noise Tests
This page allows you to view raw histograms of dark frames shot at 1/100s with all possible ISO settings of the Canon EOS 5D Mark II. Move your mouse over the list of ISO sensitivities on the left to view the corresponding histogram. You can get the original file (csv) with the histogram data by clicking the link. If you want to know how these were made see the original rawhistogram page.
- ISO 100
- ISO 125
- ISO 160
- ISO 200
- ISO 250
- ISO 320
- ISO 400
- ISO 500
- ISO 640
- ISO 800
- ISO 1000
- ISO 1250
- ISO 1600
- ISO 2000
- ISO 2500
- ISO 3200
- ISO 4000
- ISO 5000
- ISO 6400
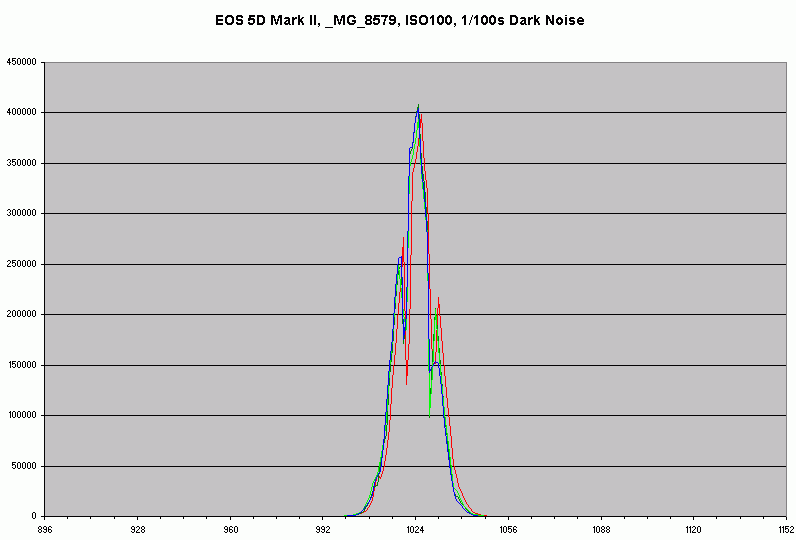
The intermediate (1/3) ISO settings of the 5D Mark II are "fake" just like in the 30D and 40D and as far as I am aware all other Canon DSLRs that have them, apart from the EOS 5D and the EOS 1D. There are two groups of intermediate ISO settings, the "125, 250, 500, 1000, 2000" group is derived by multiplying (upscaling) the previous whole ISO and the "160, 320, 640, 1250, 2500" group is derived by dividing (downscaling) the next whole ISO. This is clearly visible from the graphs - since the data in the first group is in effect "stretched" the histograms exhibit gaps. The histograms in the second group are "compressed" and therefore have "spikes". If you compare this to the EOS 30D test you will observe the same effect. Because of this "stretching" and "compressing" ISOs like 160 appear very good in the following noise graph and 125 and the like appear bad. This is however deceptive - it is a purely mathematical manipulation of the data and therefore when shooting raw is useless - the same effect can be achieved by shooting at whole ISOs and pushing or pulling the image during raw conversion. When shooting JPEG on the other hand the intermediate settings can be useful.
The ISO sensitivities above 3200 seem to be simply a mathematical scaling, there does not seem to be an analog gain for 6400.
The graph below represents the signal/noise ratio as a function of ISO speed. If you prefer dB units to "counts" move your mouse over the image. Since this is a ratio of maximum signal to dark noise it essentially represents the dynamic range of the camera. Keep in mind that there are other sources of noise in addition to the dark noise measured here. A Google query should give you some quite good introductory information.
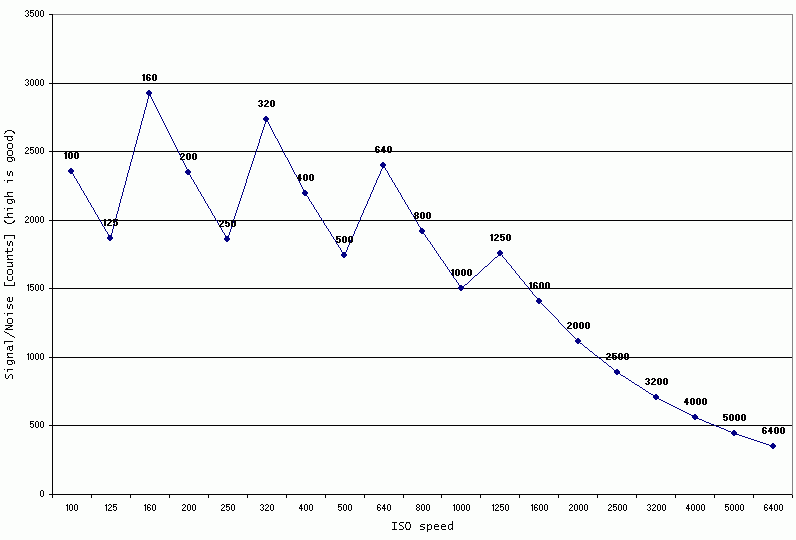
The values were calculated as follows:
SNcounts = (2^14 - Mean)/Sd

SNdB = 20 * log(SNcounts)
Where "Mean" is the mean of the histogram (very close to 1024 for all ISOs) and "Sd" is the standard deviation - which is what increases with noise.
Copyright © 2011 Peter Ruevski. All rights reserved.
The 5D Mark II raw files were kindly provided by a colleague at Photovacation.
Last modified 2011-10-16