Canon EOS 5D Dark Noise Tests
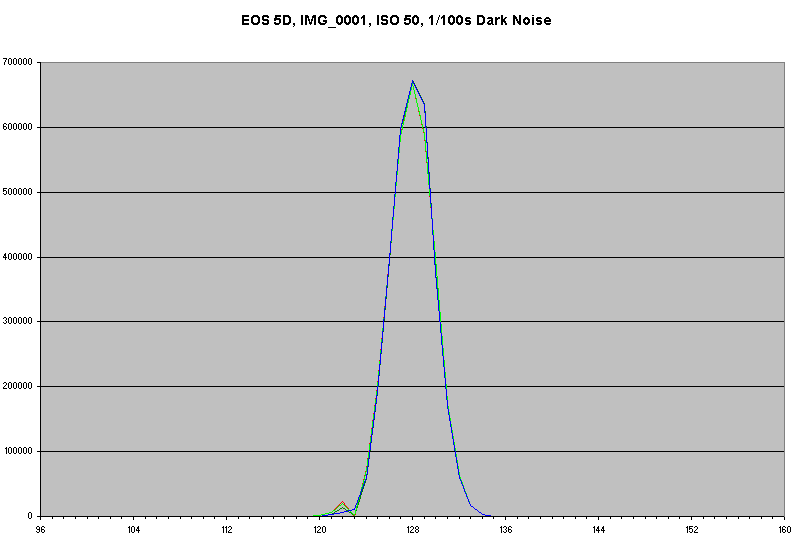
This page allows you to view raw histograms of dark frames shot at 1/100s with all possible ISO settings of the Canon EOS 5D. Move your mouse over the list of ISO sensitivities on the left to view the corresponding histogram. You can get the original file (csv) with the histogram data by clicking the link. If you want to know how these were made see the original rawhistogram page.
- ISO 50
- ISO 100
- ISO 125
- ISO 160
- ISO 200
- ISO 250
- ISO 320
- ISO 400
- ISO 500
- ISO 640
- ISO 800
- ISO 1000
- ISO 1250
- ISO 1600
- ISO 3200
The graph below represents the signal/noise ratio as a function of ISO speed. If you prefer dB units to "counts" move your mouse over the image. Since this is a ratio of maximum signal to dark noise it essentially represents the dynamic range of the camera. Keep in mind that there are other sources of noise in addition to the dark noise measured here. A Google query should give you some quite good introductory information. The 5D is better than the 30D for all whole ISO speeds (i.e. 100, 200, 400 etc.) and behaves like the EOS 1D Mark III for all intermediate ISO speeds (i.e. 125, 160 etc.) which seem to be achieved from the previous whole one with an extra amplifier. This is in contrast to the 30D where the intermediate ISOs are fake. Considering the above and that the 5D was released in September 2005 it is an impressive achievement and the camera still holds it own against many current (as of February 2008) cameras.
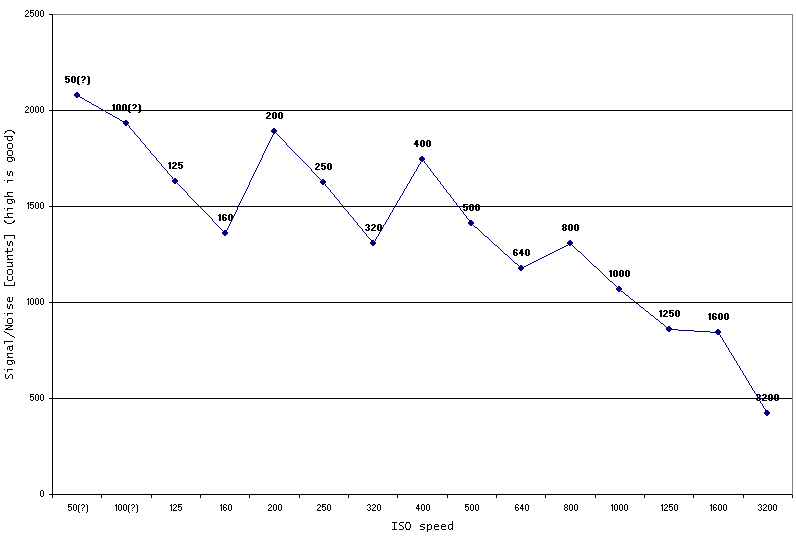
The values were calculated as follows:
SNcounts = (2^14 - Mean)/Sd

SNdB = 20 * log(SNcounts)
Where "Mean" is the mean of the histogram (very close to 128 for all ISOs) and "Sd" is the standard deviation - which is what increases with noise.
Copyright © 2008 Peter Ruevski. All rights reserved.
Last modified 2008-05-13