Canon EOS 1D Mark III Dark Noise Tests
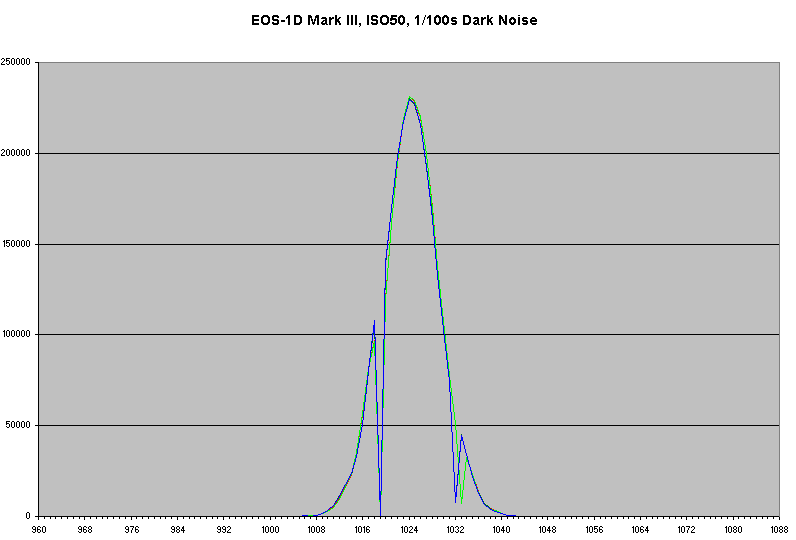
This page allows you to view raw histograms of dark frames shot at 1/100s with all possible ISO settings of the Canon EOS 1D Mark III. Move your mouse over the list of ISO sensitivities on the left to view the corresponding histogram. You can get the original file (csv) with the histogram data by clicking the link. If you want to know how these were made see the original rawhistogram page.
- ISO 50
- ISO 100
- ISO 125
- ISO 160
- ISO 200
- ISO 250
- ISO 320
- ISO 400
- ISO 500
- ISO 640
- ISO 800
- ISO 1000
- ISO 1250
- ISO 1600
- ISO 2000
- ISO 2500
- ISO 3200
- ISO 6400
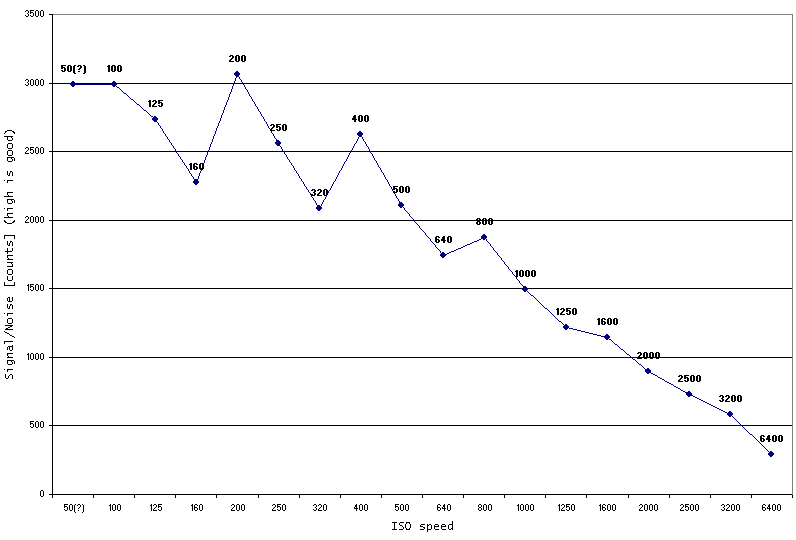
The graph below represents the signal/noise ratio as a function of ISO speed. If you prefer dB units to "counts" move your mouse over the image.
Since this is a ratio of maximum signal to dark noise it essentially represents the dynamic range of the camera.
For example ISO 100 looks worse than 200 because at ISO 100 the pixels saturate at only 15280 counts and even though the dark noise is lower (StdDev = 4.77)
the dynamic range ends up equal to (15280-1024)/4.77 = 2989. At ISO 200 on the other hand the saturation is 16383 counts and the
dark noise is 5.02 so the dynamic range is equal to (16384-1024)/5.02 = 3060. This does not mean that ISO 200
photos will look less noisy - in fact for dark tones they may look noisier because the dark noise is slightly higher. However ISO 200 does have more dynamic range.
Also keep in mind that there are other sources of noise in addition to the dark noise measured here.
A Google query
should give you some quite good introductory information.
The values were calculated as follows:
SNcounts = (2^14 - Mean)/Sd

SNdB = 20 * log(SNcounts)
Where "Mean" is the mean of the histogram (very close to 1024 for all ISOs) and "Sd" is the standard deviation - which is what increases with noise.
Copyright © 2007-2008 Peter Ruevski. All rights reserved.
The Mark III raw files were kindly provided by Steve Saunders at the
Open Photography Forums
Last modified 2008-02-13