Sony Alpha DSLR-A700 Dark Noise Tests
This page allows you to view raw histograms of dark frames shot at 1/100s with all possible ISO settings of the Sony Alpha DSLR-A700. Move your mouse over the list of ISO sensitivities on the left to view the corresponding histogram. You can get the original file (csv) with the histogram data by clicking the link. If you want to know how these were made see the original rawhistogram page.
- ISO 100
- ISO 125
- ISO 160
- ISO 200
- ISO 250
- ISO 320
- ISO 400
- ISO 500
- ISO 640
- ISO 800
- ISO 1000
- ISO 1250
- ISO 1600
- ISO 2000
- ISO 2500
- ISO 3200
- ISO 4000
- ISO 5000
- ISO 6400
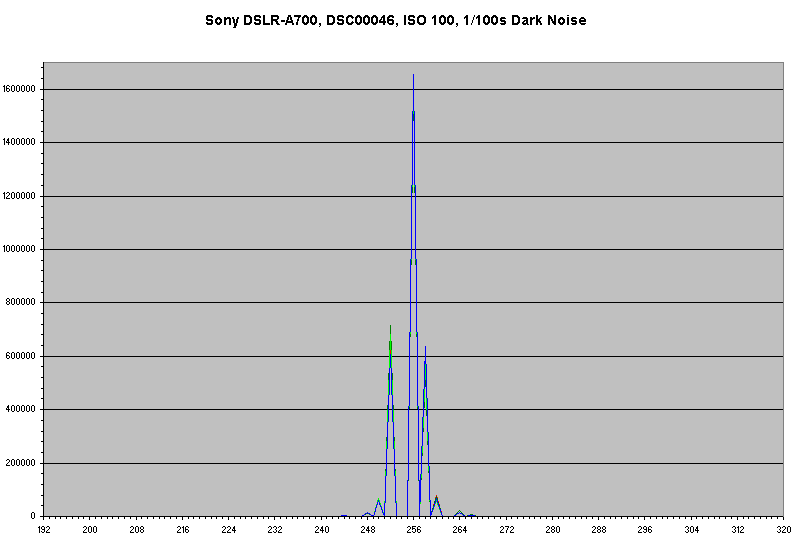
What is this!? These histograms look like gaussian curves passed through a paper shredder! Maybe this is what they mean by "CMOS imager with on-chip noise-canceling before and after A/D conversion" when they talk about their Exmor™ (what does that mean?) imager... At least they left a bias of 256 counts in there.
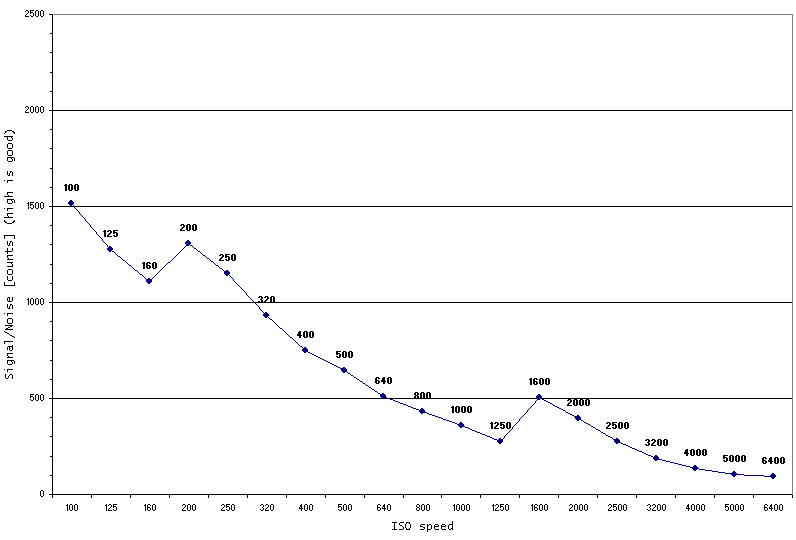
The graph below represents the signal/noise ratio as a function of ISO speed. If you prefer dB units to "counts" move your mouse over the image. Since this is a ratio of maximum signal to dark noise it essentially represents the dynamic range of the camera. Keep in mind that there are other sources of noise in addition to the dark noise measured here. A Google query should give you some quite good introductory information.
It seems that all that "noise-canceling before and after A/D conversion" does not do much for the dark noise. It probably was not designed to. But the dark noise is where the skill of the circuit designers really shows. And as far as dark noise is concerned you are better off shooting the Canon EOS 30D at ISO 800 rather then the A700 at any ISO above 100! And ISO 100 on the Alpha is just slightly better then ISO 800 on the 30D! Also notice the jumps in the graph at ISO 200 and ISO 1600 - presumably this is where the noise reduction is increased.
The values were calculated as follows:
SNcounts = (2^14 - Mean)/Sd

SNdB = 20 * log(SNcounts)
Where "Mean" is the mean of the histogram (very close to 256 for all ISOs) and "Sd" is the standard deviation - which is what increases with noise.
Copyright © 2008 Peter Ruevski. All rights reserved.
Last modified 2008-02-14