Sony Alpha DSLR-A100 Dark Noise Tests
This page allows you to view raw histograms of dark frames shot at 1/100s with all possible ISO settings of the Sony Alpha DSLR-A100. Move your mouse over the list of ISO sensitivities on the left to view the corresponding histogram. You can get the original file (csv) with the histogram data by clicking the link. If you want to know how these were made see the original rawhistogram page.
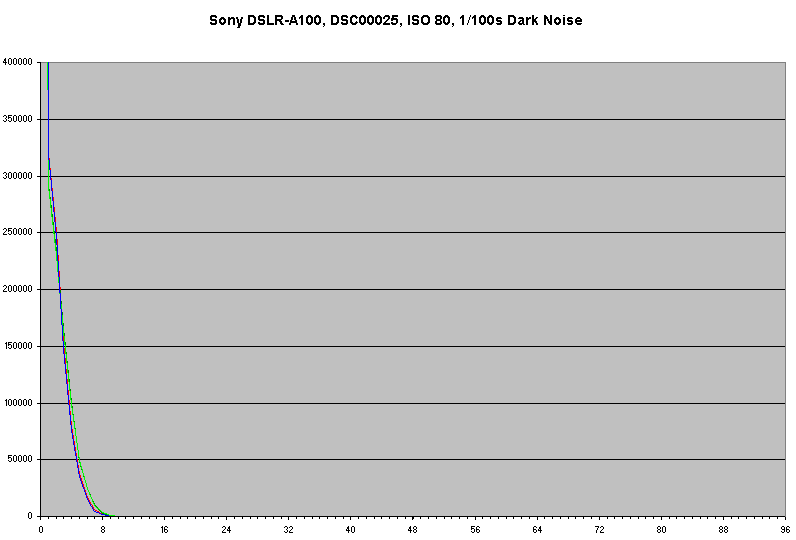
You can see that the A100 just like the Minolta 7D - and like most DSLRs apart from Canon ones - does not really have real raw data. The dark current (offset) is already subtracted from the data before writing the raw file. This makes black map to the value "0" and essentially "hides" all noise in the negative (below black) direction. You can see this from the graphs - they look like just the right half of a Gaussian curve. The left half is all piled up at pixel 0. The signal/noise ratios below were calculated based on the data as it is but in reality the standard deviations should probably be multiplied by two to make it realistic.
The graph below represents the signal/noise ratio as a function of ISO speed. If you prefer dB units to "counts" move your mouse over the image. Since this is a ratio of maximum signal to dark noise it essentially represents the dynamic range of the camera. Keep in mind that there are other sources of noise in addition to the dark noise measured here. A Google query should give you some quite good introductory information.
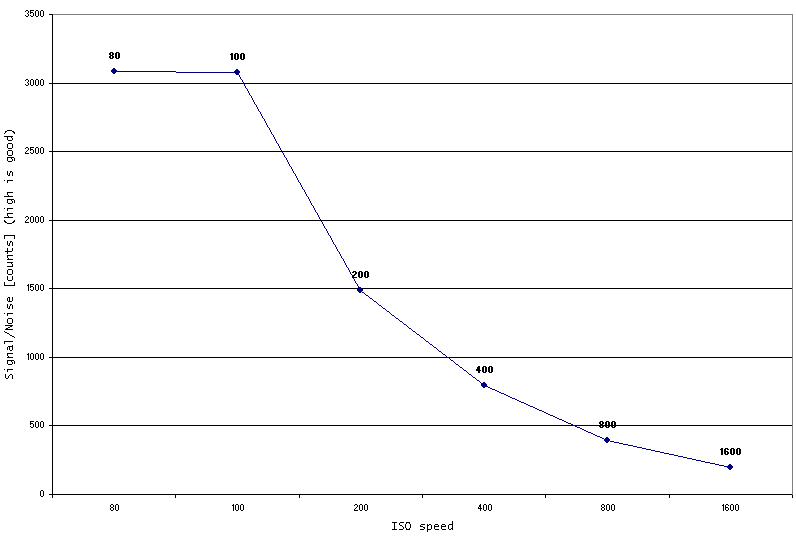
The values were calculated as follows:
SNcounts = (2^14 - Mean)/Sd

SNdB = 20 * log(SNcounts)
Where "Mean" is the mean of the histogram (very close to 0!!!! for all ISOs) and "Sd" is the standard deviation - which is what increases with noise.
Copyright © 2008 Peter Ruevski. All rights reserved.
Last modified 2008-02-27